
Revenue mobilisation in Africa continues to improve, says new report
Revenue mobilisation in Africa continues to improve, says new report
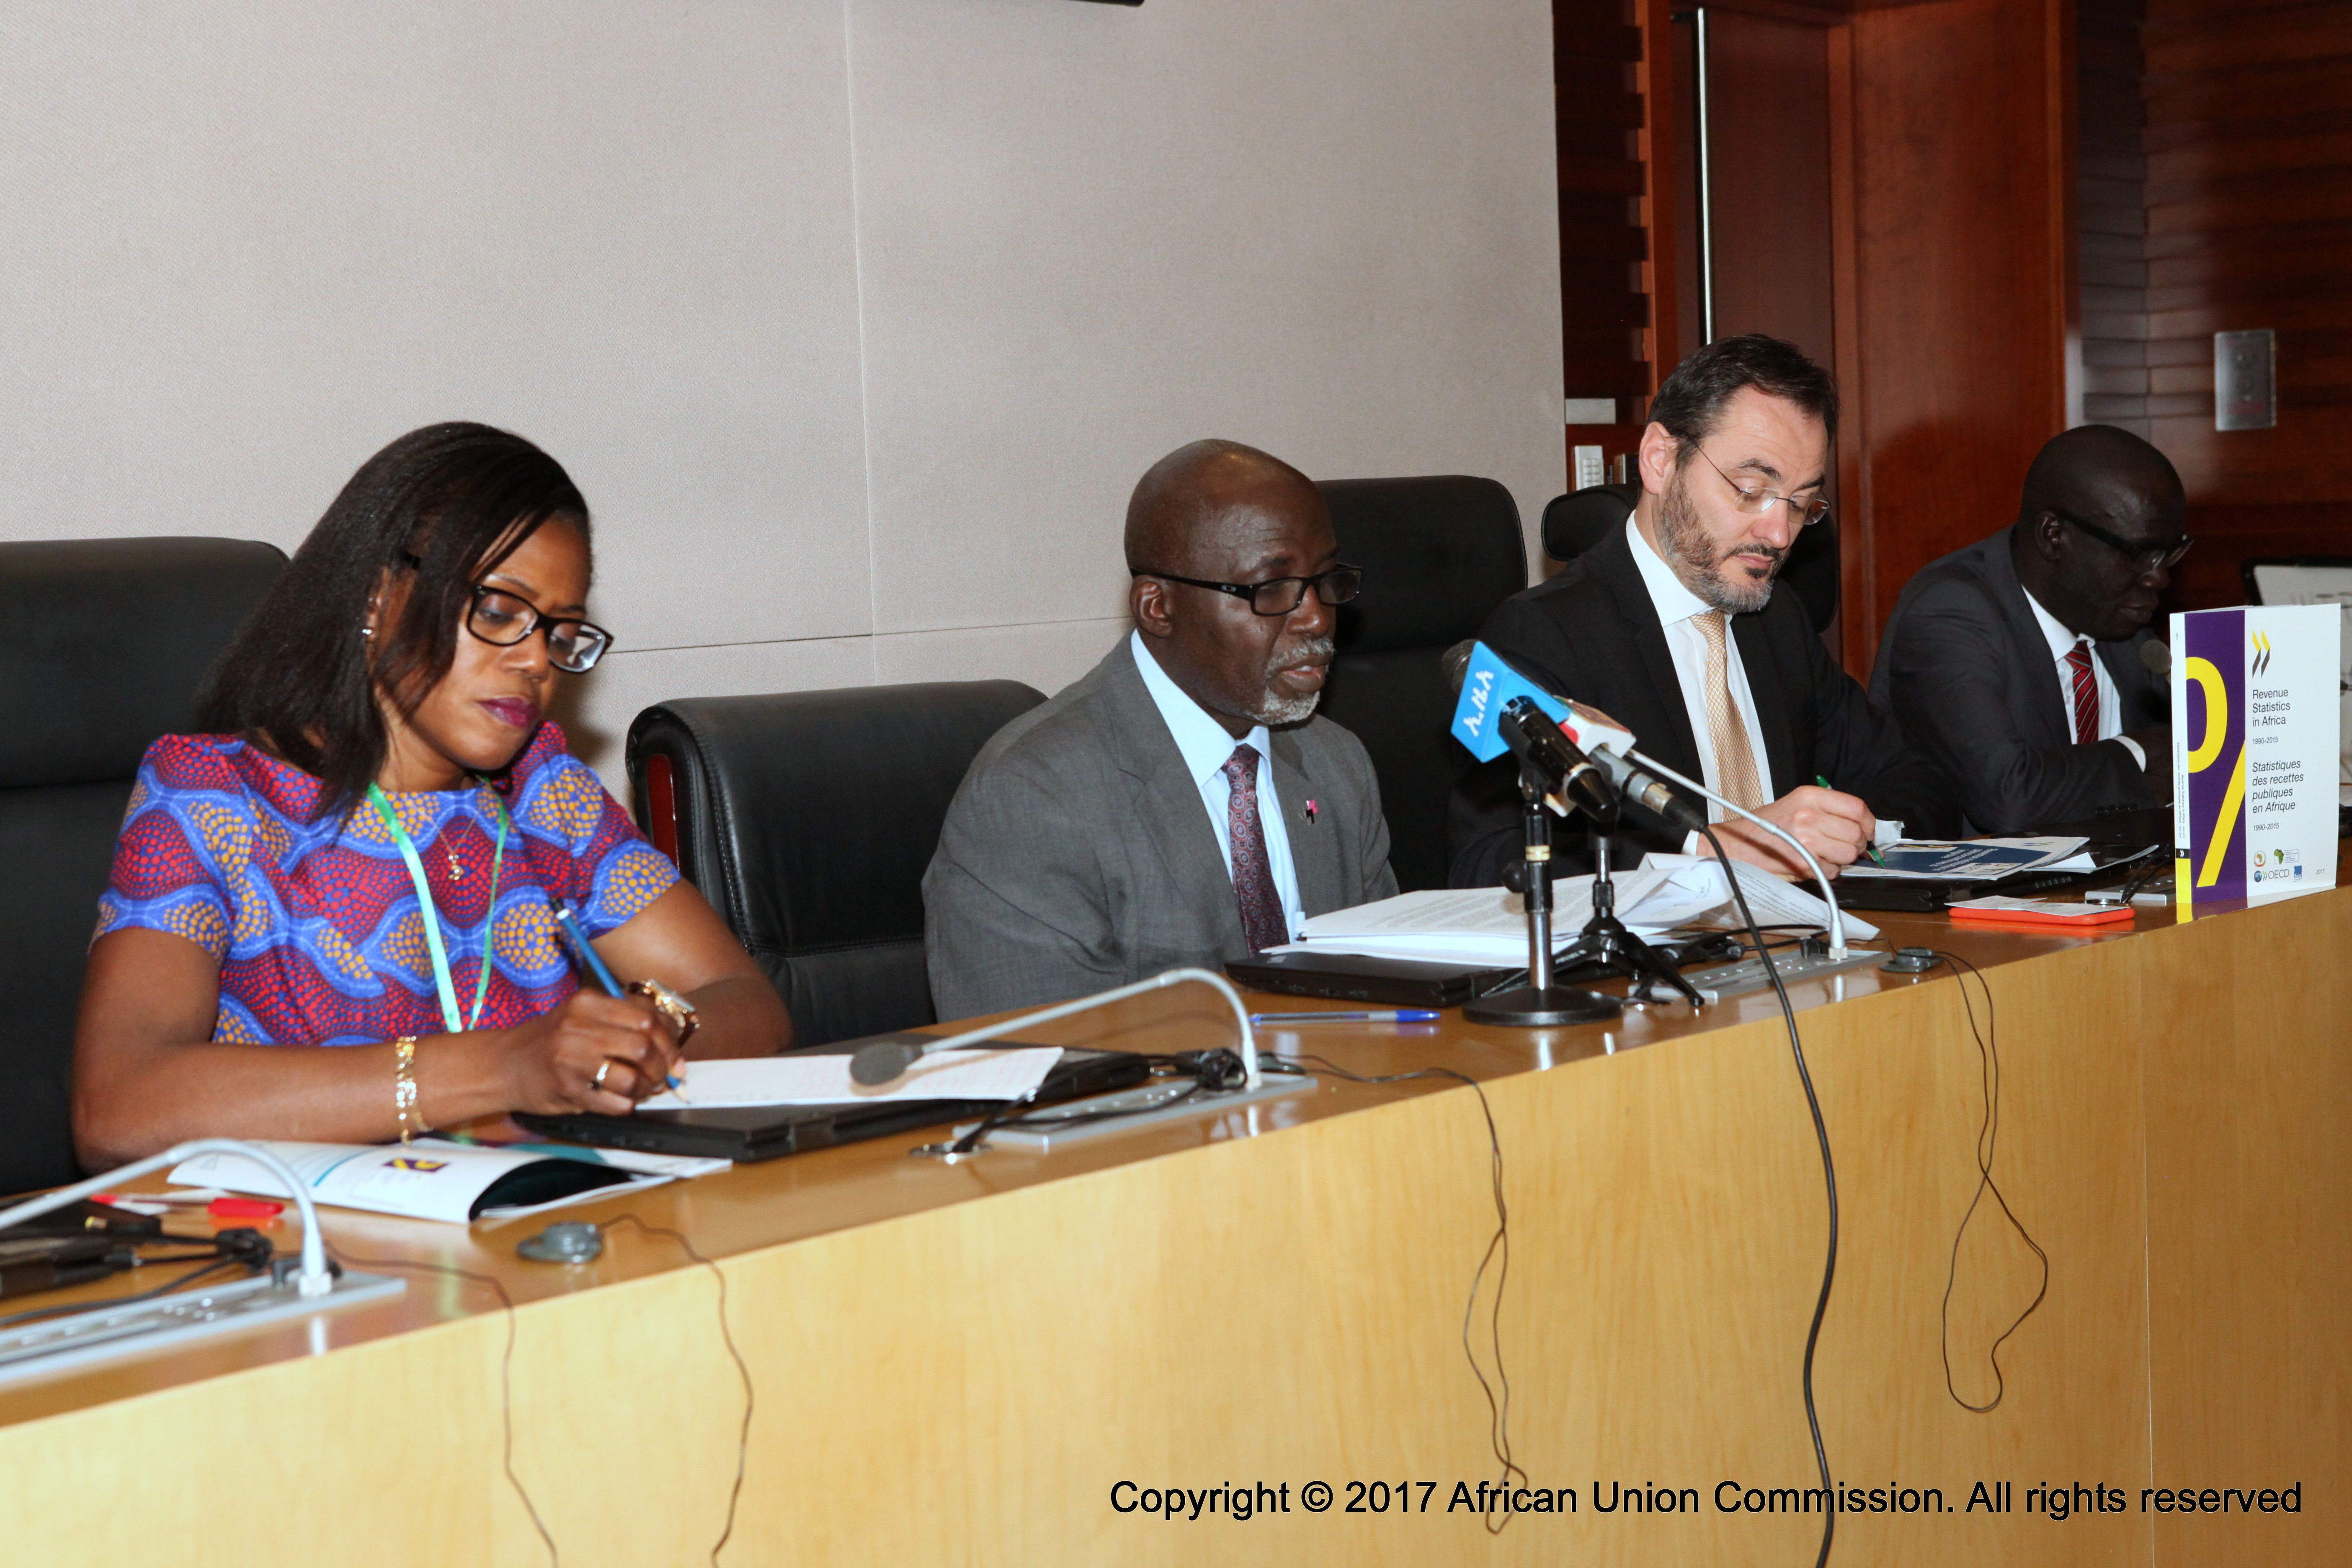
The mobilisation of domestic resources is improving steadily in African countries, according to new data from Revenue Statistics in Africa 2017 released today in Addis Ababa at a meeting of tax and finance officials from 21 African countries hosted by the Department of Economic Affairs of the African Union Commission (AUC).
The average tax-to-GDP ratio for the 16 countries covered in this second edition of the report was 19.1% in 2015, an increase of 0.4 percentage points compared to 2014. Every country has experienced an increase in its tax-to-GDP ratio compared to 2000, with an average rise of 5 percentage points.
Revenue Statistics in Africa 2017 includes revenue data for twice as many countries as the first edition, providing comparable data on tax and non-tax revenues for 16 participating countries: Cabo Verde, Cameroon, Democratic Republic of Congo, Côte d'Ivoire, Ghana, Kenya, Mauritius, Morocco, Niger, Rwanda, Senegal, South Africa, Swaziland, Togo, Tunisia and Uganda.
For the first time, the report provides an average of the participating countries - “the African (16) average”- showing that in 2015, the average tax-to-GDP ratio in these countries was 19.1%. This is lower than the average tax-to-GDP ratios for Latin America and the Caribbean (LAC) and the OECD: 22.8% and 34.3%, respectively. The average tax structure of the African countries resembled that of the LAC region, except that social security contributions were a more significant component of revenues in the latter. In 2015, taxes on goods and services were the largest contributor to total tax revenues in the African countries (57.2% on average), mostly in the form of Value-Added Tax (VAT); followed by taxes on income and profits (32.4%).
As a percentage of GDP, total non-tax revenues were lower than tax revenues in all 16 African countries, although the amounts varied considerably between countries due to a wide disparity in natural resource revenues and international donations (foreign aid, debt relief, or funding of national programmes). Non-tax revenues as a percentage of GDP also varied significantly more than tax revenues over time.
A special chapter in the report discusses the role of domestic resource mobilisation in improving governance and the business environment, particularly in the African states classified as fragile. While African countries have made significant efforts to strengthen their tax policy and tax administration capacity, they continue to face the challenges of large informal sectors, and a narrow tax base, particularly in resource-rich countries that makes them vulnerable to unstable resource revenues.
KEY FINDINGS
Taxation as a percent of GDP
• Tax-to-GDP ratios in 2015 ranged from 10.8% in the Democratic Republic of the Congo to 30.3% in Tunisia, with an average of 19.1% across the 16 countries. This is lower than the Latin American and Caribbean (LAC) and OECD averages (22.8% and 34.3%, respectively).
• Between 2014 and 2015, all featured countries except Kenya, Tunisia and Morocco increased their tax-to-GDP ratios. On average, they increased their tax-to-GDP ratios by 0.4 percentage points, a slightly lower increase than for the LAC average (0.6 percentage points) but above the OECD average (less than 0.1 percentage points).
• All countries in the publication had higher tax-to-GDP ratios in 2015 than in 2000, and all have increased more than the OECD average. Since 2000, the average tax-to-GDP ratio has increased by 5.0 percentage points, a similar increase to the LAC average (4.9 percentage points). In contrast, the OECD average grew by just 0.3 percentage points over this period.
Tax structure
• Taxes on goods and services were the principal source of total tax revenues in 2015 (57.2%, on average) and particularly VAT (31.5% on average). The share of revenues from taxes on income and profits amounted to 32.4%, on average.
• Kenya, South Africa and Swaziland obtained about half of their tax revenues from taxes on income and profits in 2015 whereas among the other 13 countries, this category ranged from 18.6% in Togo to 37.6% in Rwanda.
• Tunisia and Morocco reported the highest share of social security contributions among the 16 countries in 2015 (29.5% and 17% respectively).
• The African countries featured in this publication have significantly lower social security contributions than LAC countries. This accounts for most of the difference between their respective average tax-to-GDP ratios.
Non-tax revenues
• The total non-tax revenues collected as a percentage of GDP ranged from 0.6 % of GDP for South Africa to 15.1% of GDP for Swaziland (mostly revenues from the Southern African Customs Union). In every country, non-tax revenues were lower than tax revenues.
• Of the 14 countries for which non-tax data is available over the past ten years, eight have shown a decreasing trend in non-tax revenue to GDP ratios, and only six have shown an increasing trend.
• Non-tax revenue collections show a much higher rate of annual variation than tax revenues, sometimes varying by over 1% of GDP from one year to the next.
• The annual variation in non-tax revenue is often due to the volatility of grant and property revenues. In 2015, grants made up 7.2% of Niger’s GDP and 6.3% of Rwanda’s GDP. Property revenues made up 2.8% of Cameroon’s GDP, mainly from rents and royalties.
The report is produced jointly by the African Tax Administration Forum (ATAF), the African Union Commission (AUC) and the Organisation for Economic Co-operation and Development (OECD), with the financial support of the European Union. It contributes to improving the understanding and monitoring of domestic resource mobilisation in Africa, a priority of the 10-year implementation plan of the AUC’s Agenda 2063, the United Nations Addis Ababa Action Agenda on Financing for Development, and Sustainable Development Goal 17.1.
Find out more about the report, please visit:
www.oecd.org/tax/revenue-statistics-in-africa-2017-9789264280854-en-fr.htm
Press contacts
For further information or to get a copy of the report, journalists should contact:
• AUC: Djeinaba Kane (KaneD@africa-union.org) and Esther Azaa Tankou (yamboue@africa-union.org)
• ATAF: Dr Nara Monkam, ATAF Director of Research (nmonkam@ataftax.org;
+27 12 451 8811)
• OECD Press Office: Lawrence Speer (Lawrence.Speer@oecd.org +33 1 45 24 79 70)
• OECD Development Centre: Arthur Minsat (Arthur.Minsat@oecd.org ; +33 145 24 18 65) and Alexander Pick (Alexander.Pick@oecd.org; +33 1 45 24 87 27 )
• OECD Centre for Tax Policy and Administration: Michelle Harding (Michelle.Harding@oecd.org; +33 1 45 24 93 68)
Images
Department Resources
AFRICAN UNION CONFERENCE ON DEBT
LOME, TOGO
12th to 14th May 2025
The African Union Commission (AUC) envisions “an integrated continent that is politically united based on the ideals of Pan Africanism an
Highlights of the cooperation with the GIZ-project “Support to the African Union on Migration and Displacement”
Violent extremism is a global issue.
Agenda 2063 is Africa’s development blueprint to achieve inclusive and sustainable socio-economic development over a 50-year period.
The African Union Commission (AUC), through the Department of Health, Humanitarian Affairs and Social Development, has launched the S