


Second edition of the Labour migration Statistics report in Africa
Second edition of the Labour migration Statistics report in Africa

Labor Migration Statistics Report in Africa Second edition: Regional Migration Profile
Executive Summary
The present report has been prepared in fulfilment of the request made in July 2015 by the Assembly of Heads of State and Government that the African Union Commission should submit a biennial report on labour migration statistics in Africa.
This second edition of the Report on Labour Migration Statistics in Africa summarizes statistical information for a period of ten years (2008–17), building on the first edition, which captured data from 2008 to 2015. The focus of this report is on emerging patterns and trends in the stock of interna¬tional migrants living in African countries. An in-depth analysis of the various factors shaping labour migration does not fall under the report’s scope.
The initial step in preparing the new report was to send the first iteration of the International Labour Migration Questionnaire to the national statistical offices of all African countries, of which 48 even¬tually provided data: a total response rate of around 87 per cent. However, this high response rate is somewhat deceptive, because many countries did not provide information on a significant number of indicators covered by the questionnaire. Appropriate imputation methods were therefore used to supplement the available data where necessary.
Despite the difficulty in obtaining comparable data because of the use of various sources (e.g. popu¬lation surveys and administrative records) based on different definitions and approaches, a number of key findings were extracted as outlined below.
Africa is still the continent with the fastest-growing population in the world (UNDESA, 2019).
Over the ten years covered by this report, the African population increased from 944,433,089 in 2008 to 1,215,953,341 in 2017 (JLMP database, 2018): an increase of about 271.5 million, or 28.75 per cent, which translates into an average annual growth rate of 2.8 per cent.
The world female population is slightly higher than the male. A similar slight preponderance of women may be observed in Africa as a whole (in 2017, there were 608.6 million women and 607.3 million men) and in each of the eight regional economic communities formally recognized by the African Union.
Demographic factors play a significant role in regional economic communities. The country grouping with the highest population in 2017 was the Community of Sahel-Saharan States (646.0 million people), followed by the Common Market for Eastern and Southern Africa (509.6 million people), the Economic Community of West African States (371.4 million people) and the Southern African Devel¬opment Community (326.8 million people). By contrast, the Arab Maghreb Union, which comprises five countries, had the smallest population (95.2 million people).
There was a net increase in the working-age population in Africa: in 2017, it was estimated at 662.5 million, compared with 509.5 million in 2008, which represents an increase of 30.04 per cent. In 2017, the number of working-age women, at 335.6 million, was slightly higher than that of working-age men, at 329.6 million (Table P2). However, the total labour force of 433.8 million in 2017 contained more men (245.5 million) than women (188.4 million) (Table P3). More efforts clearly need to be undertaken to achieve gender parity, particularly for more women participating in productive works, including counting women involved in own-use production work (i.e. home-based activities, family business and caregiving) as another form of participation in productive work.
International migration in Africa accelerated over the decade covered by this report, increasing from 13.3 million migrants in 2008 to 25.4 million in 2017: a massive increase of 91.2 per cent, which translates into an average annual growth rate of 7.5 per cent. Working-age migrants, who totalled 19.7 million in 2017, predominate in the international migrant stock in Africa (figure 1).
There were an estimated 14.4 million international migrant workers in 2017.
The estimates of 14.4 million of international migrant workers in Africa in 2017 is different from the ILO global estimate on international migrant workers of 13 million (ILO, 2018a) due to different methodological approaches used. – a significant increase from 7.5 million in 2008.
The speed of increase of migrant workers is more quickly than the speed of increase of people in the labour force of African countries. The average annual growth rate of the migrant worker population between 2008 and 2017 was 7.5 per cent, which was more than the average annual growth rate of the total population.
In producing this edition of the Report on Labour Migration Statistics in Africa, the most signifi-cant challenge lay in determining the number of employed migrant workers. Only a few countries provided relevant data, for example, Algeria, Botswana, Eswatini, Ghana, Liberia, Namibia, Niger and Nigeria. Among these countries, 84.3 per cent of migrant workers were employed in 2016.
The data from the above-mentioned responding countries in 2016 indicate that the proportion of female migrant workers who were in employment highlights the need for further efforts to provide equal opportunities for male and female migrant workers. Young people aged 15 to 35 years accounted for 26.6 per cent of the total number of employed migrant workers in 2016 in those aggregated reporting countries.
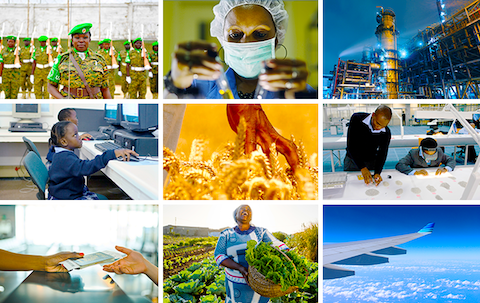
The agricultural sector (fisheries, livestock, forestry, and other agriculture-related activities) was by far the largest employer of migrant workers in the responding countries in 2016, accounting for 24.9 per cent of such workers. The next three most significant employment sectors for migrant workers in 2016 were trading (including wholesale and retail and related services) at 17.7 per cent; public administration (including education, health and social services) at 17.1 per cent; and the construction sector at 10.4 per cent. Altogether, these four sectors accounted for over 74 per cent of employed migrant workers in the responding countries.
The majority of employed migrant workers across the responding countries have basic skills and tend to work in elementary occupations, including agricultural workers, independent traders in the informal sector and labourers on construction sites. Nevertheless, the number of higher-skilled migrant workers has increased over the years. For example, the proportion of directors, executives and managers among migrant workers rose from 7.1 per cent in 2010 to 9.1 per cent in 2016, while the share of administrative employees went up from 8.9 to 13.0 per cent over the same period.
This report attempted to bring to the fore the evidence of the contribution of remittances to the development of migrants’ countries of origin, particularly towards alleviating poverty and social inequality in the recipient households and communities of origin. Unfortunately, it is essential to note that the magnitude of remittances entering African countries continue to be underestimated due to the proliferation of informal remittance networks to avoid high transaction costs affecting many migrant workers. Hence, there is the scarcity of good coverage in reporting the volume of remittances by migrant workers. The available data indicates that migrant workers’ remittances from Nigeria and Egypt amounted to an estimated US$75,747.4 million in 2017, US$69,616.77 million in 2016 and US$70,795.57 million in 2015.
Ressources
ECOWAS LABOUR MIGRATION STRATEGY AND ACTION PLAN (2025–2035)
Labor Migration Statistics Report in Africa Second edition: Regional Migration Profile
Executive Summary
Agenda 2063 is Africa’s development blueprint to achieve inclusive and sustainable socio-economic development over a 50-year period.
Mapping Exemplars of Good Practice In Foundational Literacy and Numeracy in AU Member States